Customize and Run a Report
- From the Report Library list, select a standard report type (Type column = 'Standard). The report page opens in a new browser tab.
-
Using the Date Range section, configure a date range and date type to report
on.
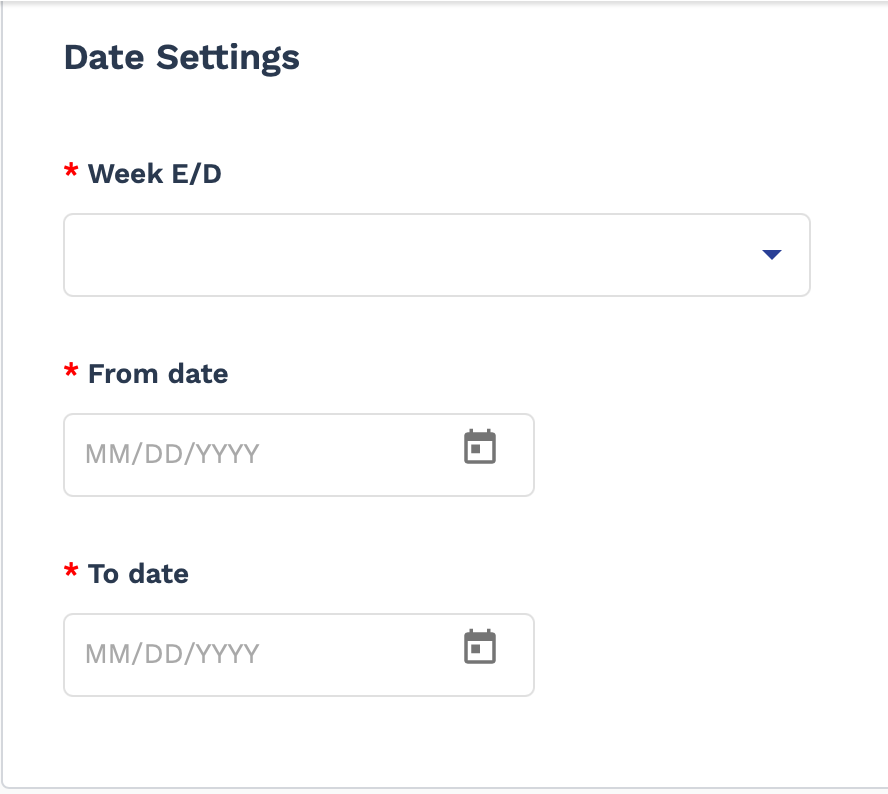 Note:Some report date ranges are limited to a certain period of time (for example, one year).
 -
From the report filters (Additional Settings section),
select which data sets to report on.
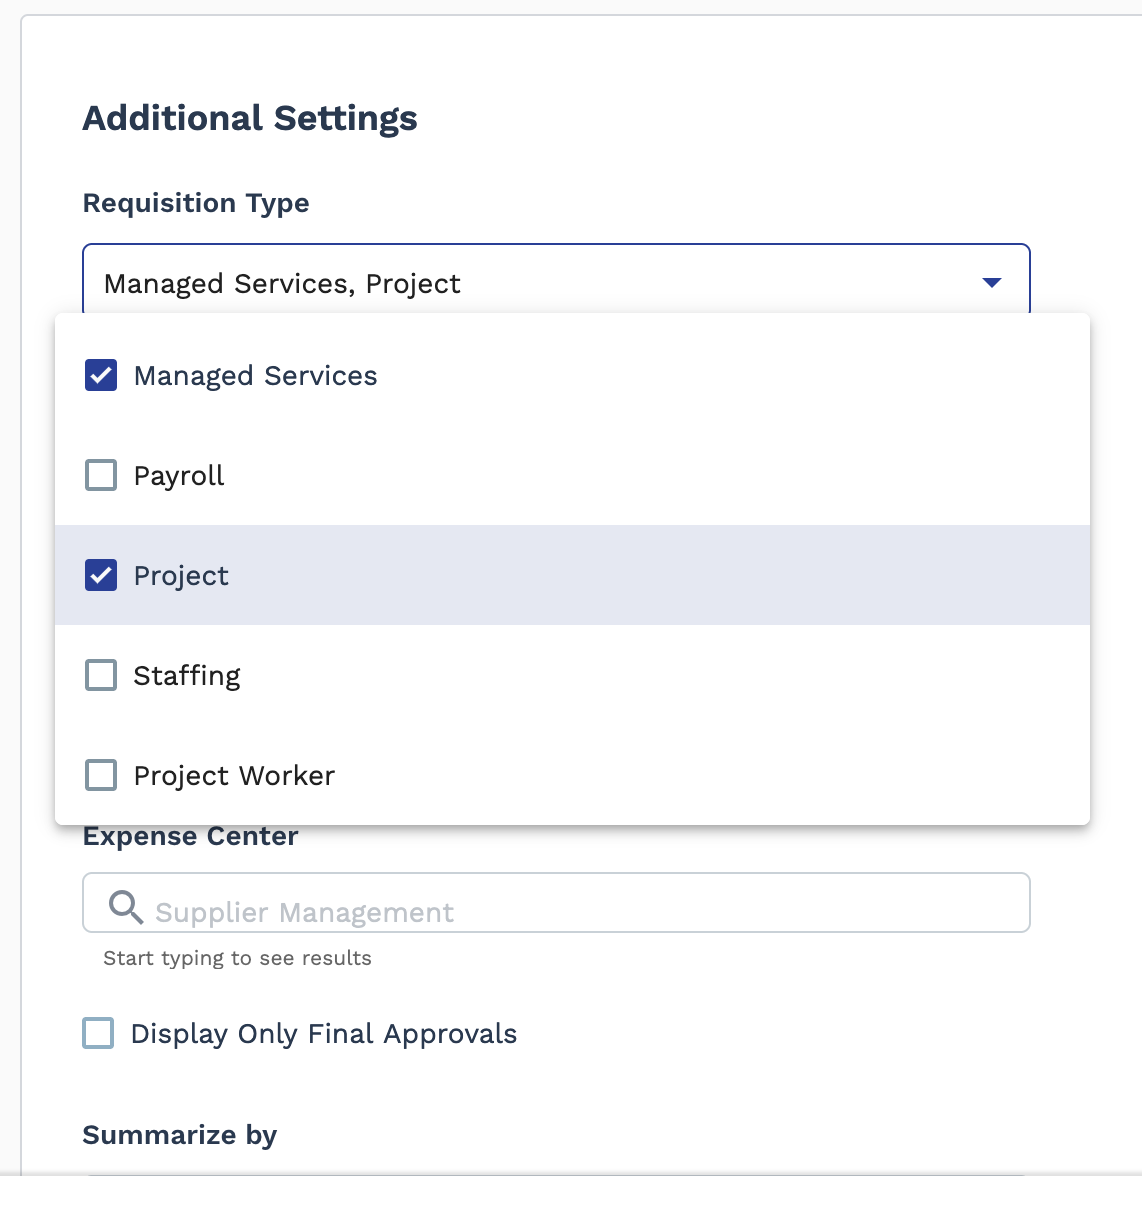 Note:Each report features a specific set of data filters. For more information about available filters, see the relevant report page.
 -
Click
 to generate the report. See Report Output Types.
-
From the Report Library list, select a customizable
report type (Type column = 'Customizable'). The report
page opens in a new browser tab.
If you need to modify a saved customizable report (My Reports section), click the blue text for the report in the Report Name column.
-
From the report filters, select which data sets to report on.
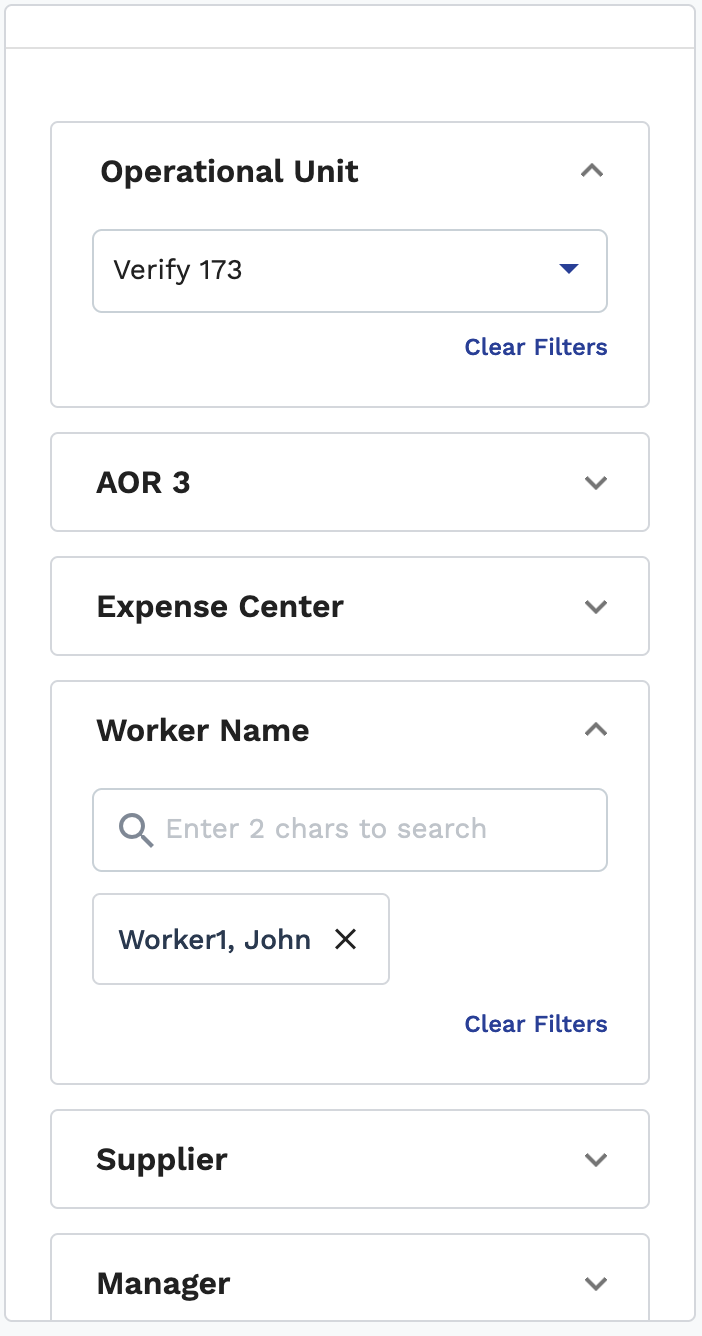 Note:Each report features a specific set of data filters. For more information about available filters, see the relevant report page.
 -
Using the date range configurations, specify a date range and date type to
report on.
Note:Some report date ranges are limited to a certain period of time (for example, one year).
-
Click
 .
.
-
In the pop up, using the menu options, configure the columns to include (or
exclude) in the report output.
Note:A red asterisk (*) indicates a required field.
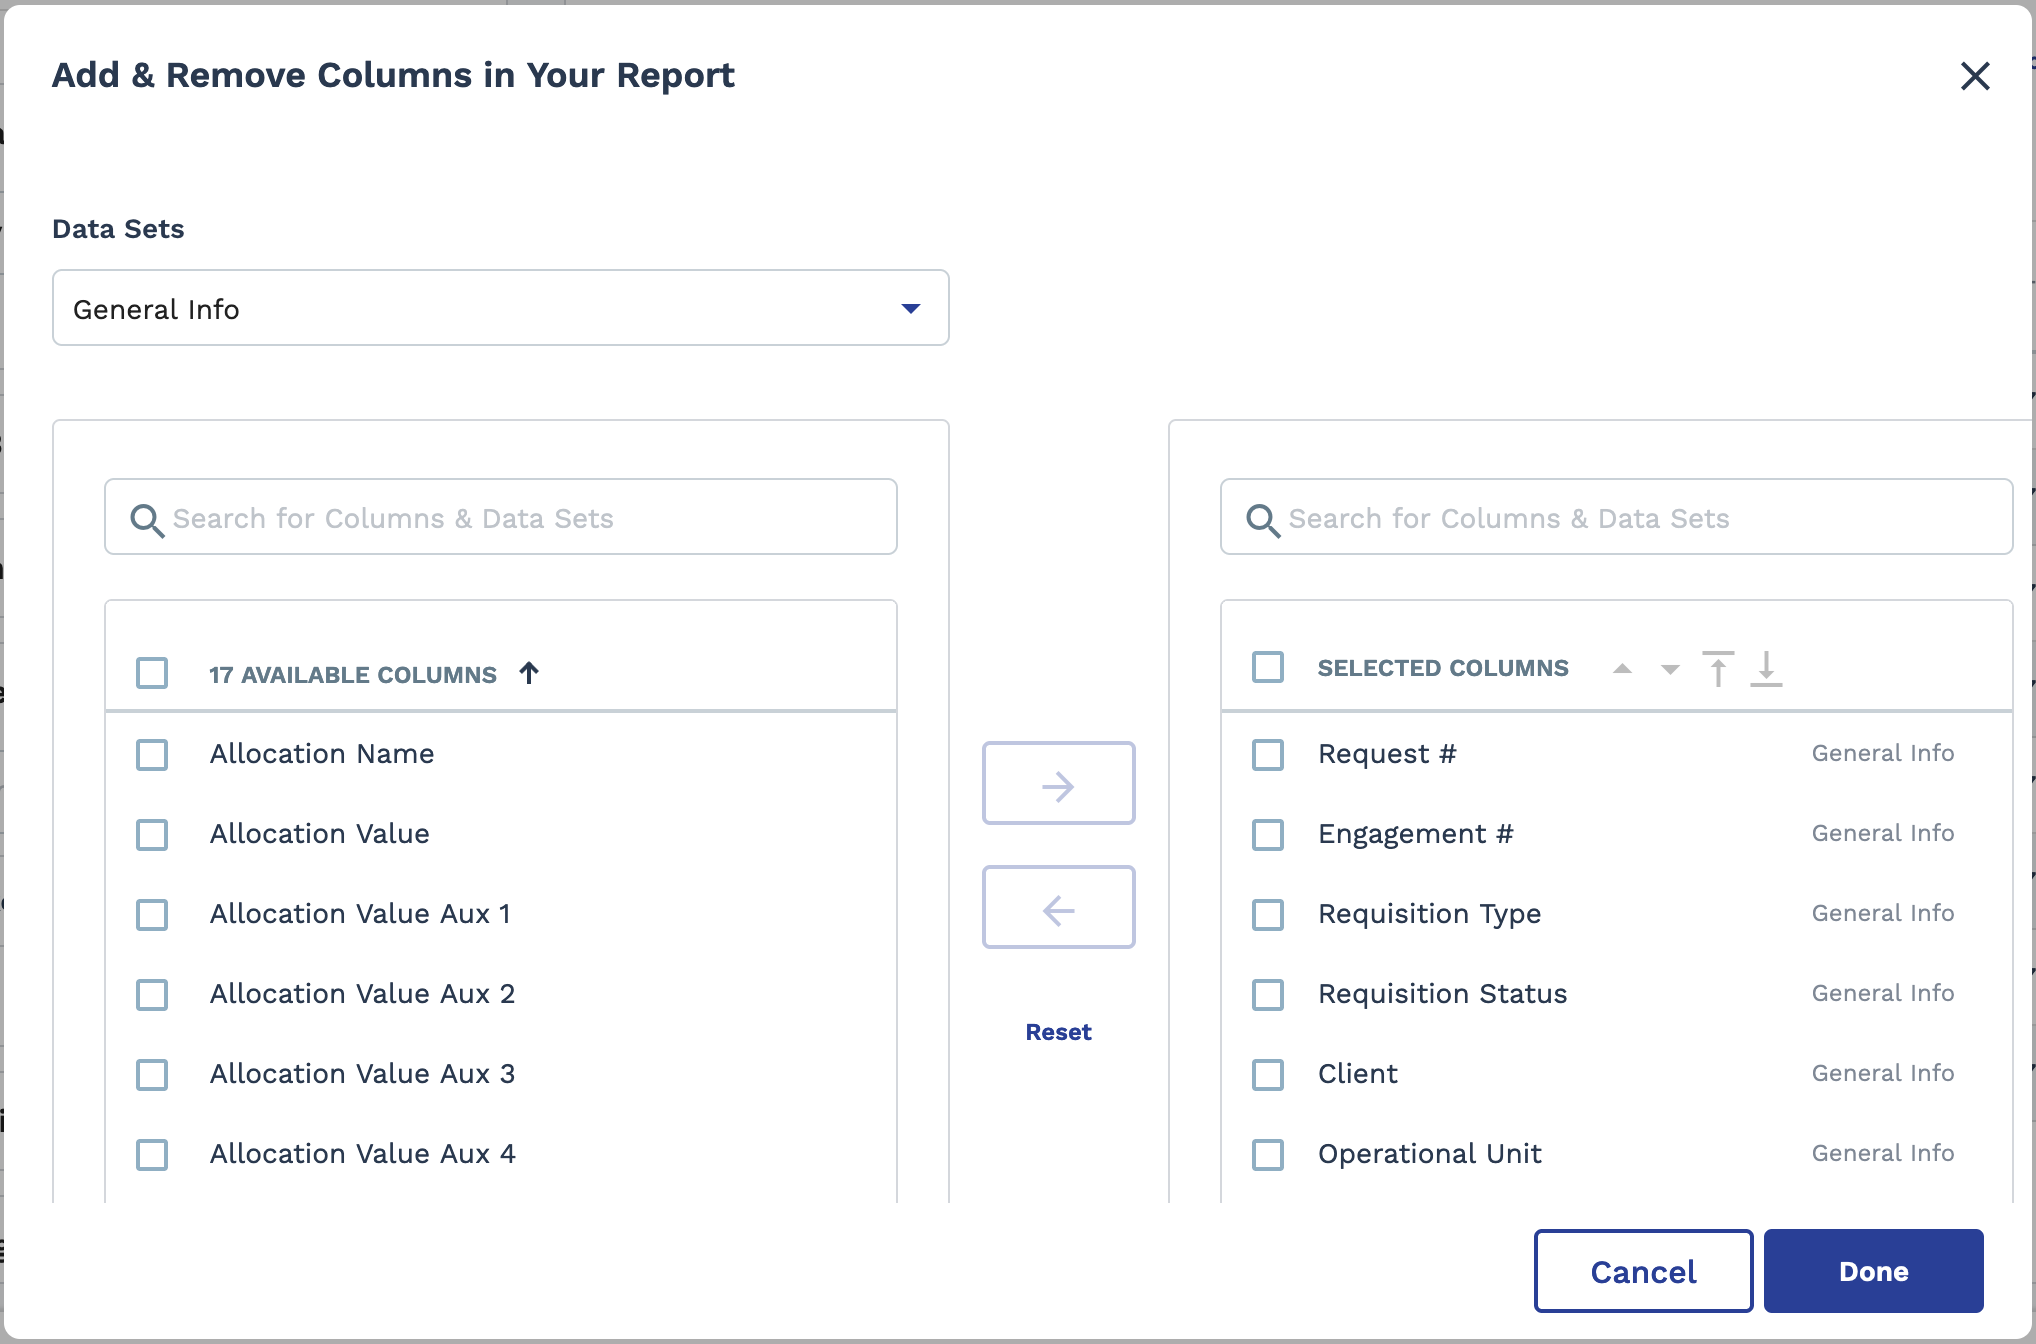
The Available Columns section (left side) displays optional data fields that you can include. Optional data fields are grouped into data sets, and the table can be filtered using the Data Sets drop down. The Selected Columns section (right side) displays the data fields that are included in the output.
Use the buttons as follows:- Check box column - Select the column data to move into or from the report. You can click the check box in the header row to select all columns in the displayed data set.
 - Moves a selected data field in the
data set to the report output.
- Moves a selected data field in the
data set to the report output. - Moves a selected data field in the
data set out of the report output.
- Moves a selected data field in the
data set out of the report output. - Resets all data fields to the default
report output.
- Resets all data fields to the default
report output.
Reorder the report output using the up and down arrows in the Selected Columns section header. You cannot drag and drop data fields into position in the display table. You can locate a data field in the display using the search field at the top of either data field table.
-
Click
 .
.
The report automatically runs. You can export the output. If you anticipate any data changes, you can refresh the report page by clicking
 .
.