Performance Home
This dashboard is available to all MPS users for the client organization.
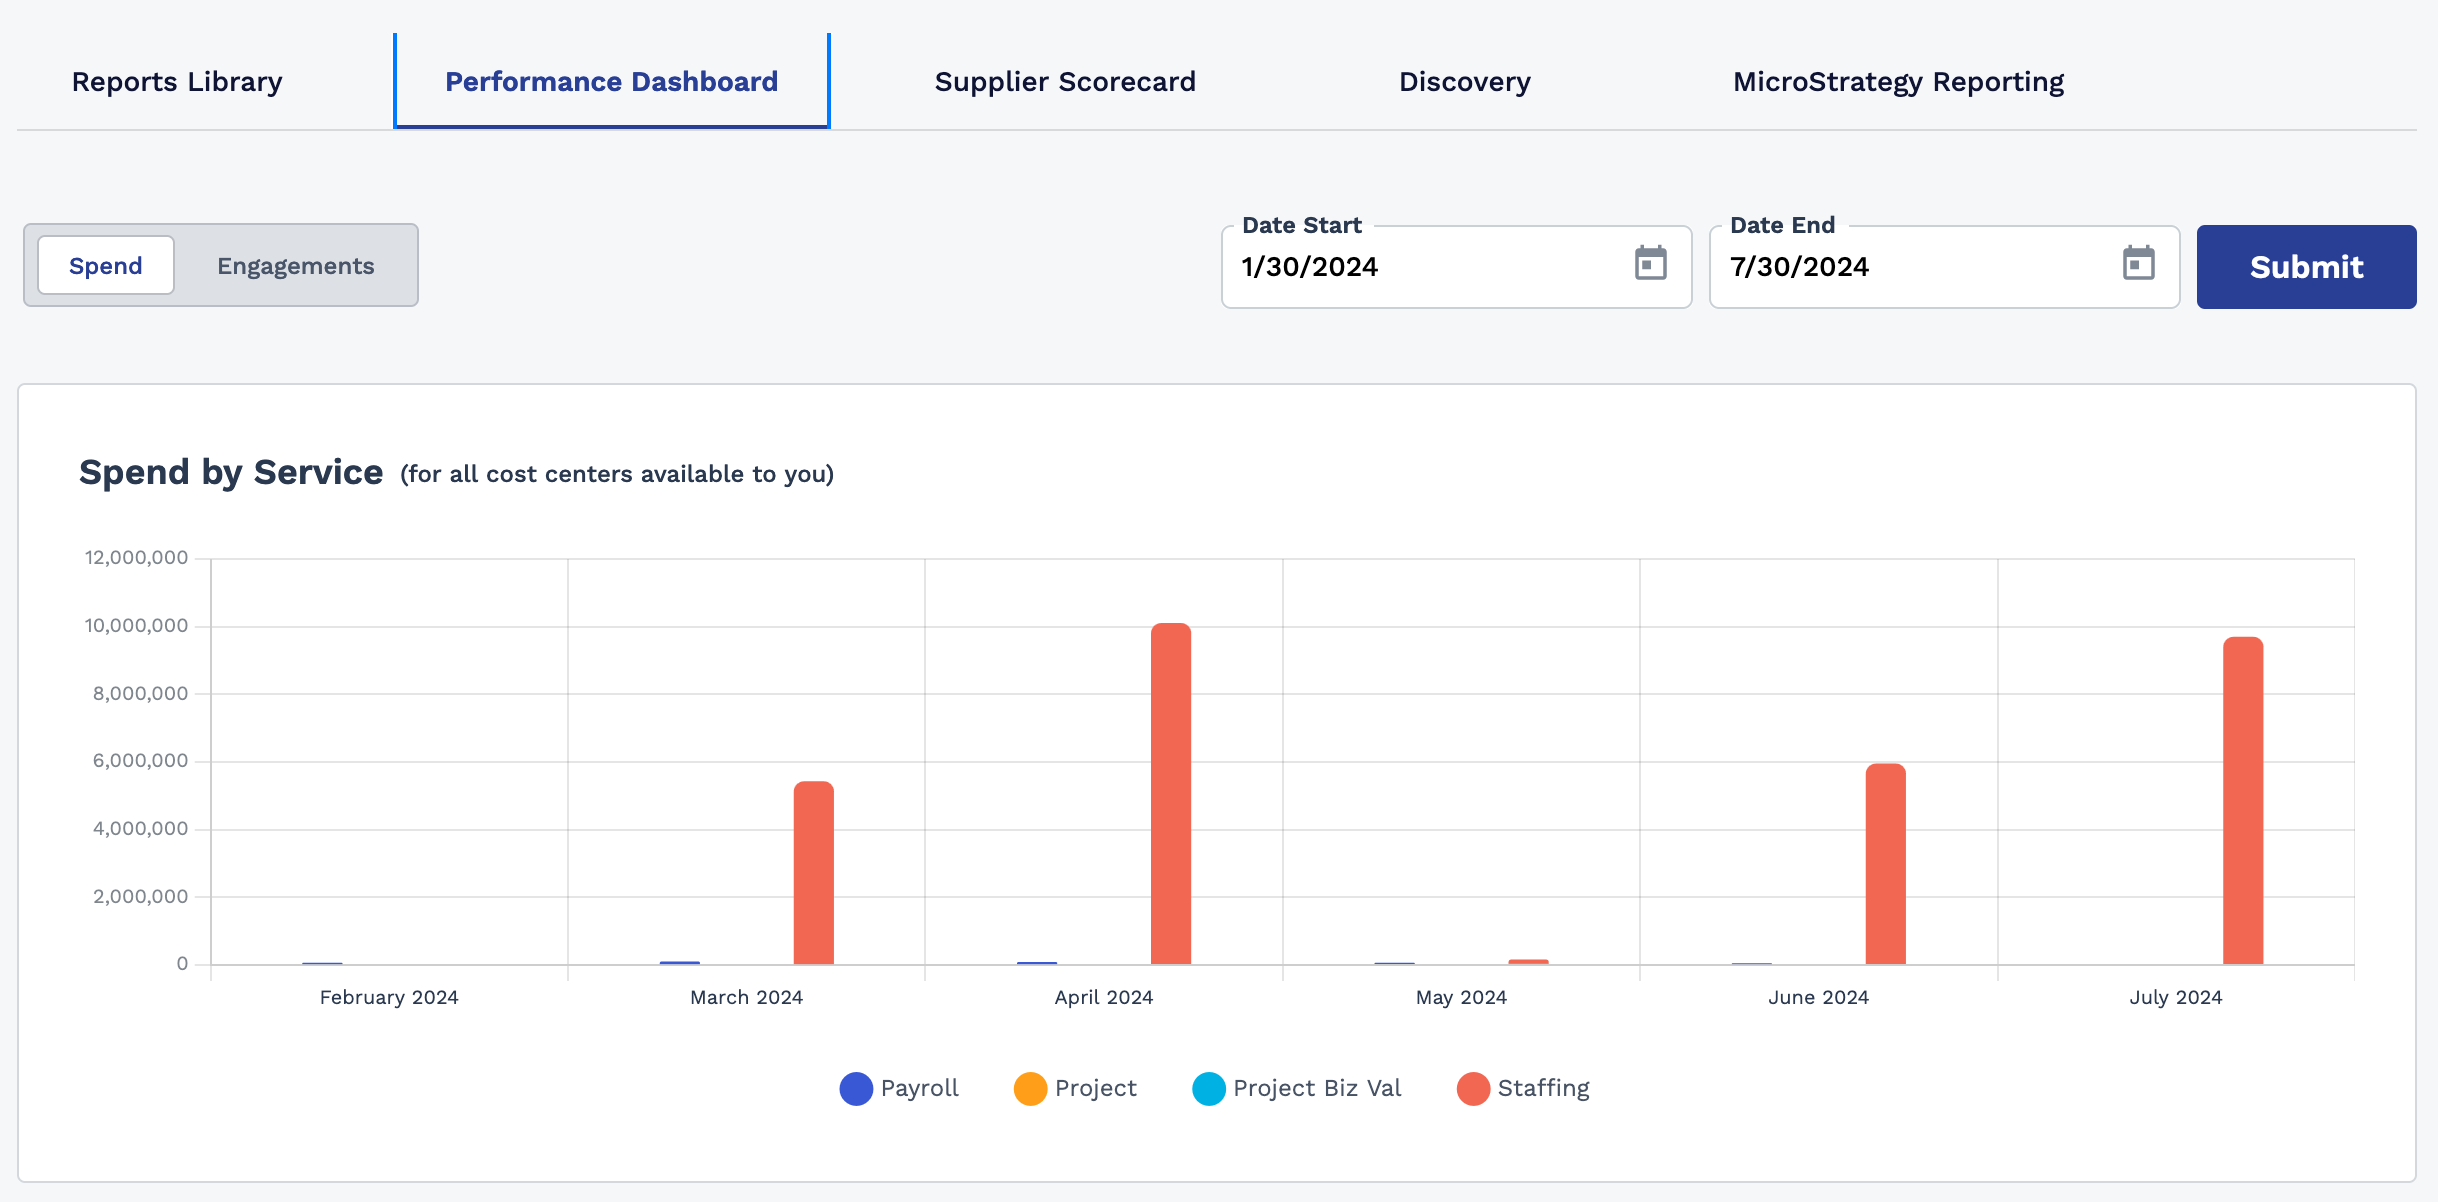
Hover over an element in the graph to display the actual value for that element.
You can filter the data in the display by entering a date range (Time Span fields).
| Tab | Graph | Description |
|---|---|---|
| Spend | Spend by Service | The total spend by service line per month for a 6 month period
only. Only processed billing is included and total billing amounts are included. Spend month is determined by the Invoice E/D. |
| Spend by Category | The total spend by client job category. Job categories are defined at the client level () or operational unit level (). See Job Category Configuration. Only processed billing is included and total billing amounts are included. Spend month is determined by the Invoice E/D. |
|
| Overtime Spend | The overtime spend by percentage of spend and spend amount. Only processed billing is included. Amounts are based on the bill rate and the OT/DT modifier. |
|
| Engagements | Fills by top 5 Position | The number of filled positions by the top 5 client job
categories. Only engagements with Status = 'Filled' included. |
| Fills by top 5 Supplier | The number of filled positions by the top 5 supplier/vendors,
including Magnit Global's supplier organization. Only engagements with Status = 'Filled' included. |
|
| Engagements by Tenure | The number of filled positions by date range. Only engagements with Status = 'Filled' included. Tenure is based on the number of days in the engagement. |